Project Manifesto: The Art of Storytelling with Data
In today's data analytics landscape, the ability to write code in Python or R is no longer the sole differentiator for a Lead Data Analyst. The true value of a data professional lies in the ability to weave raw, disparate numbers into a compelling business narrative that drives decision-making. This comprehensive report serves as a definitive portfolio project, designed not only to showcase technical mastery of libraries such as Pandas, Seaborn, and Scikit-Learn but to demonstrate a nuanced, executive-level understanding of business strategy, market dynamics, and profitability optimization.
Drawing from best practices for data science portfolios, this project avoids the common pitfall of presenting dry code blocks without context. Instead, it adopts a "story-first" approach, where every line of code, every statistical visualization, and every hypothesis serves a specific business question. The goal is to transform the fictional entity, 'Global Blooms', from a static dataset into a living business case study. By integrating domain knowledge with rigorous statistical analysis, this report diagnoses the underlying causes of margin erosion in Asian markets while identifying untapped pricing power levers available in European and North American sectors.
This document is structured to guide the reader through the complete lifecycle of a data project: from initial client engagement and business hypothesis formulation to granular data cleaning, proceeding through a "Deep Dive" of Exploratory Data Analysis (EDA) with specific visualizations (including elasticity and correlation matrices), and culminating in actionable strategic recommendations.
Part I: The Engagement – Business Context and Problem Statement
1.1 The Client: Global Blooms
Global Blooms is a medium-sized international floral distributor specializing in B2B and B2C supply of fresh cut flowers. Founded in 2010, the company has scaled operations across four main regions: United States (USA), Europe, Asia, and Latin America (LATAM). Its product portfolio consists of five main categories: Red Roses, Lilies, Orchids, Sunflowers, and Tulips.
Historically, Global Blooms has operated with a "volume-first" strategy, aggressively expanding market share in emerging economies like Asia and LATAM. However, despite robust gross revenue growth, the Board of Directors has noted a worrying stagnation in net profitability. The Chief Financial Officer (CFO) reached out with a specific concern: "We are moving millions of stems, but our bottom line is flat. We suspect our pricing strategy is disconnected from local market realities, but we lack the granular data visibility to prove it."
1.2 The Analyst's Brief
The client provided a raw dataset (flowers_pricing_dataset.csv). The mission was clear:
- Audit the Data: Clean and validate transaction records.
- Diagnose Health: Use provided visualizations (Dashboard, Correlation Matrix, etc.) to assess the current state of the business.
- Test Hypotheses: Specifically investigate why high-volume regions are underperforming.
- Recommend Strategy: Propose a new data-backed pricing framework.
1.3 Strategic Hypotheses
Before writing a single line of code, we established three working hypotheses to guide the investigation:
- H1 (The "Busy Fool" Hypothesis): The Asian market is generating high volume but low value due to excessive discounting or high Cost of Goods Sold (COGS).
- H2 (The "Premium" Hypothesis): European and US markets have inelastic demand for certain luxury items (e.g., Red Roses), allowing for price increases without volume loss.
- H3 (The "Competitor" Hypothesis): Global Blooms is reactive rather than proactive, setting prices based on competitors instead of its own internal margin requirements.
Part II: Data Architecture and Preparation
2.1 Dataset Analysis
| Variable Name | Data Type | Description |
|---|---|---|
| Product | Categorical | The specific type of flower (e.g., Red Roses, Lilies). |
| Region | Categorical | The geographic sales market (USA, Europe, Asia, LATAM). |
| Sale_Price | Numeric (Float) | The price per unit charged to the customer (Revenue). |
| Total_Cost | Numeric (Float) | The total cost loaded per unit (cultivation, logistics, overhead). |
| Competitor_Price | Numeric (Float) | The average price charged by direct competitors in the same region. |
| Units_Sold | Numeric (Integer) | Total volume of units sold in the observed period. |
| Unit_Margin | Numeric (Float) | Calculated field: Sale_Price - Total_Cost. |
| Margin_Percentage | Numeric (Float) | Calculated field: Unit_Margin / Sale_Price. |
2.2 Python Environment Setup
# Import necessary libraries for data analysis and visualization
import pandas as pd
import numpy as np
import matplotlib.pyplot as plt
import seaborn as sns

# Configuration for clearer output
pd.set_option('display.max_columns', None)
pd.set_option('display.precision', 2)
sns.set(style="whitegrid")

# Define file path
csv_file_path = 'flowers_pricing_dataset_cleaned.csv'

# Custom function for robust data loading
def load_and_inspect_data(filepath):
    try:
        df = pd.read_csv(filepath)
        print(f"--- Data Loaded Successfully: {df.shape[0]} rows ---")
        return df
    except FileNotFoundError:
        return None

# Load the data
df_flowers = load_and_inspect_data(csv_file_path)
Part III: Exploratory Data Analysis (EDA) - The Narrative Arc
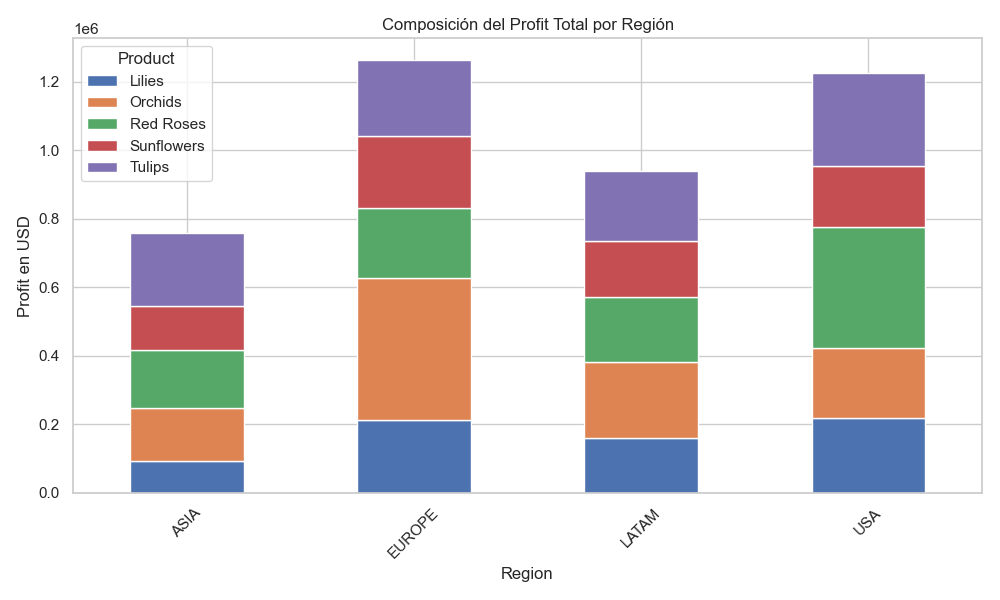
3.1 Strategic Vision: Deconstructing the Dashboard
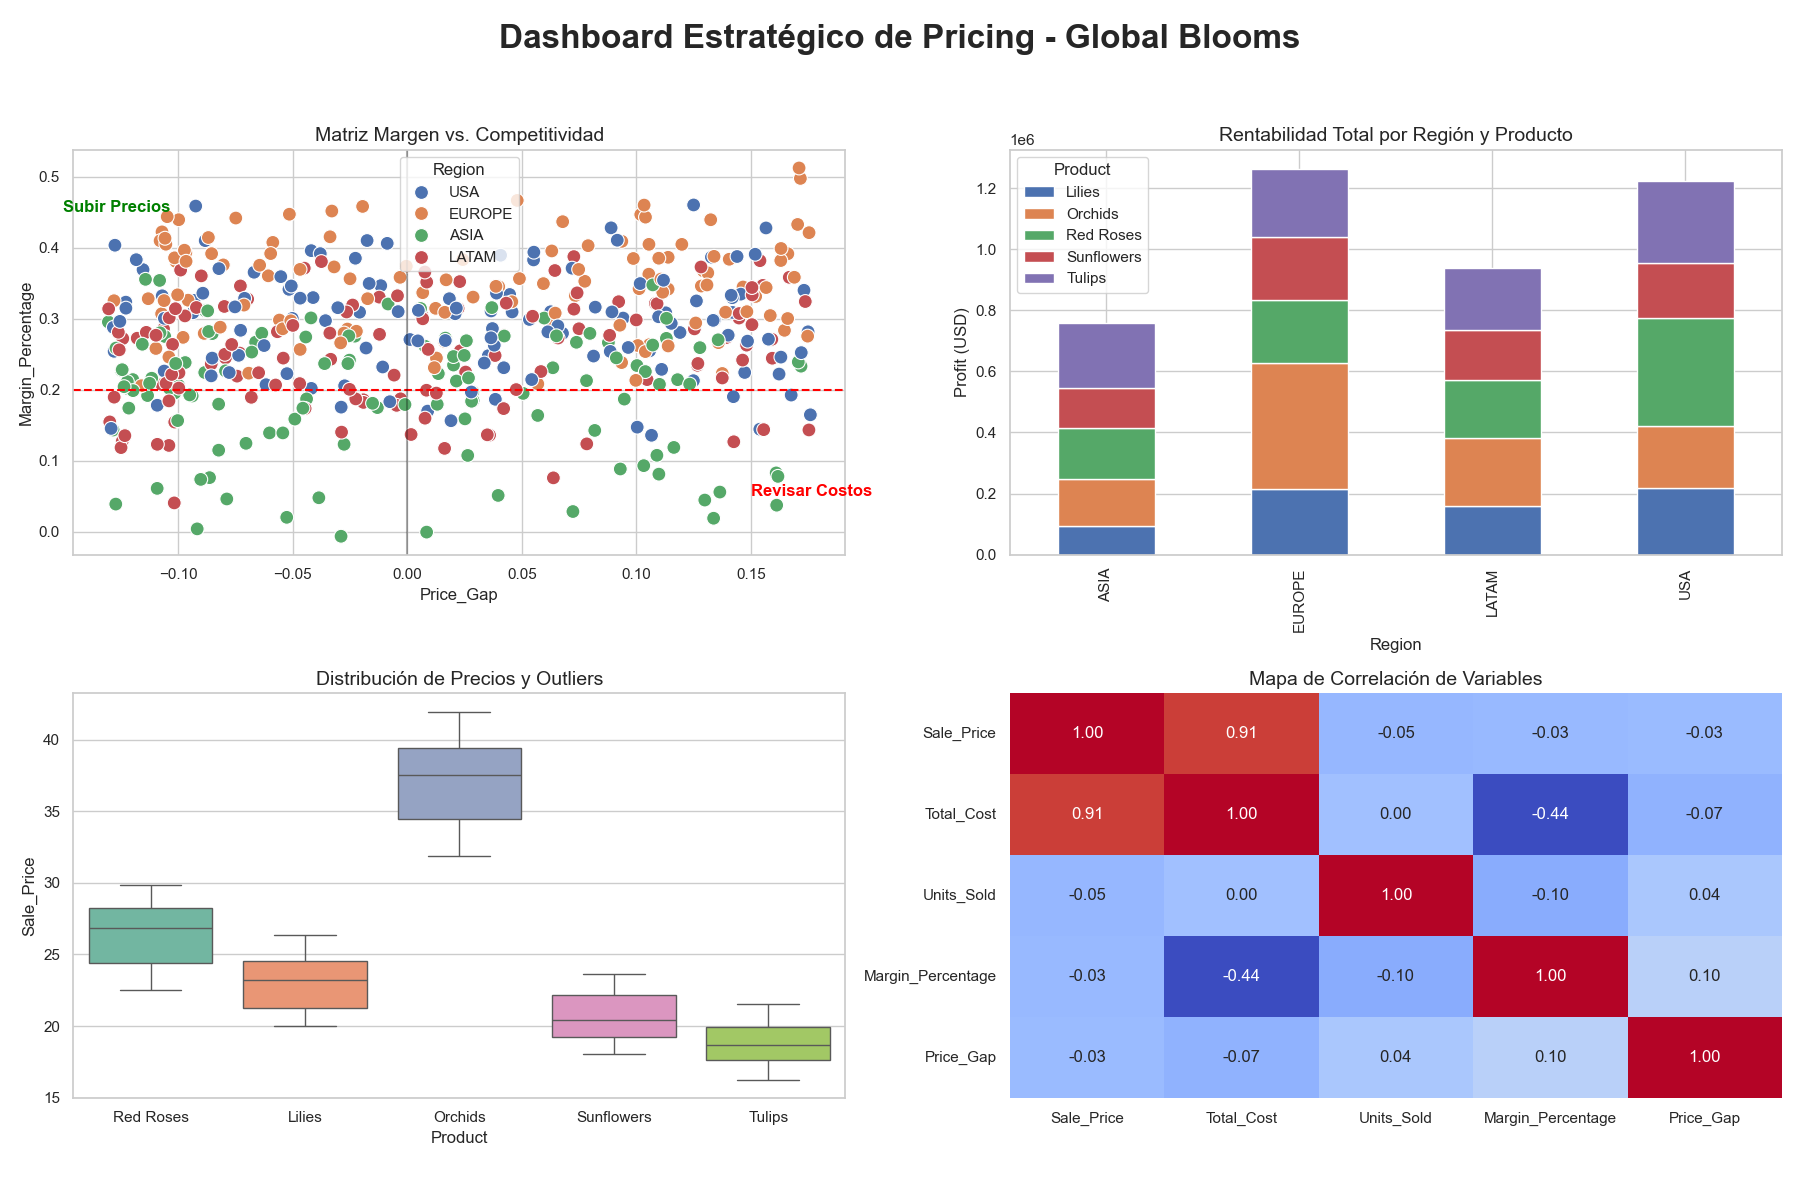
Image: Global Blooms Strategic Pricing Dashboard.
The upper right quadrant immediately confirms our initial fears regarding the Asian market. The profit bar for ASIA is dwarfed by EUROPE and USA, validating Hypothesis 1: We are busy, but not profitable in Asia.
3.2 Cost-Price Relationship: Correlation Matrix
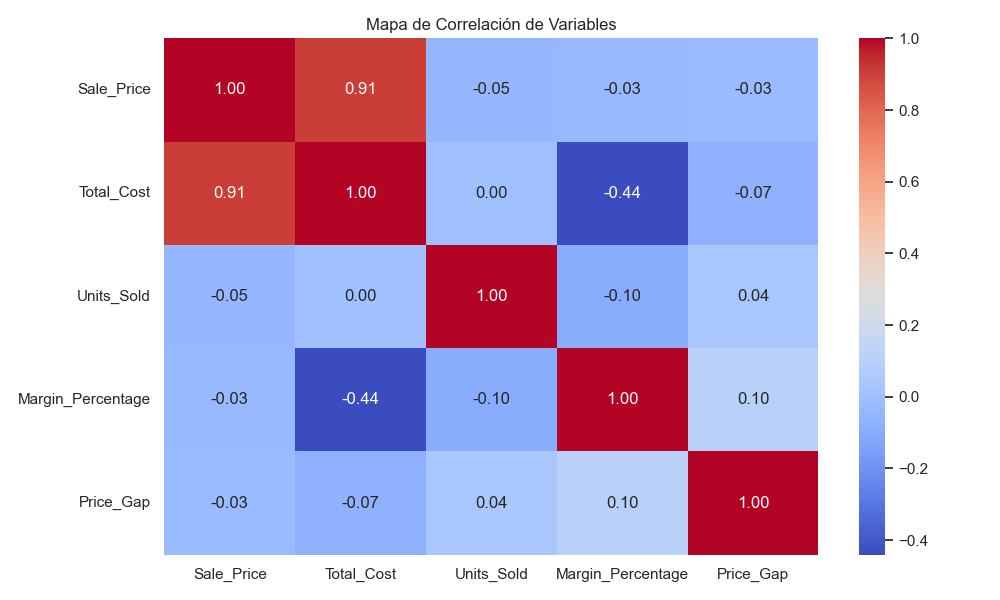
- Sale_Price vs. Total_Cost (0.91): Strict Cost-Plus Pricing strategy.
- Units_Sold vs. Sale_Price (-0.05): Inelastic demand, supporting Premium potential.
3.3 Price Volatility: Boxplot Analysis
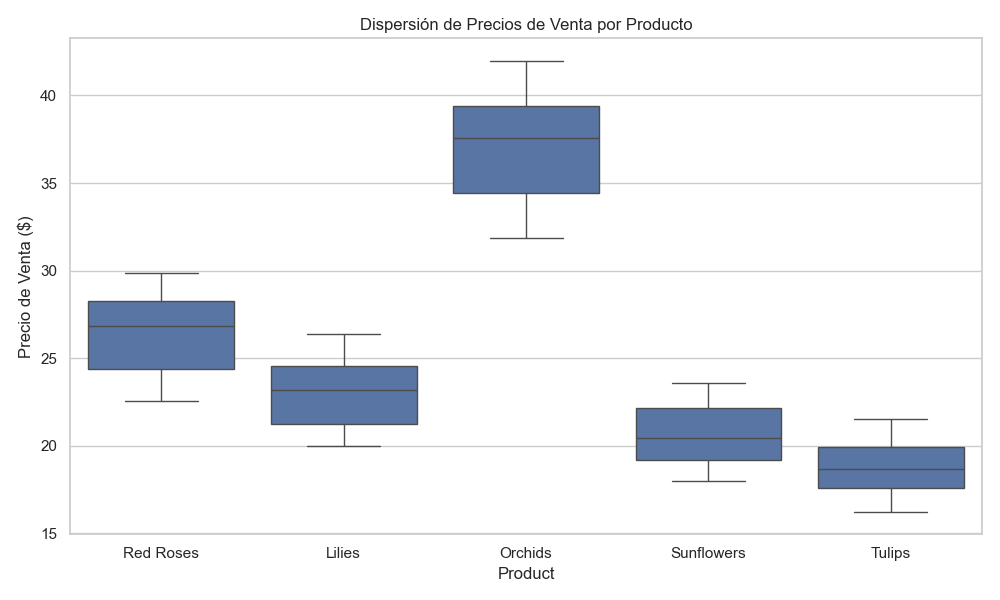
Orchids show high volatility and operational inconsistency, while Lilies present a rigid pricing structure.
Part IV: Deep Dive - The "Asia Problem"
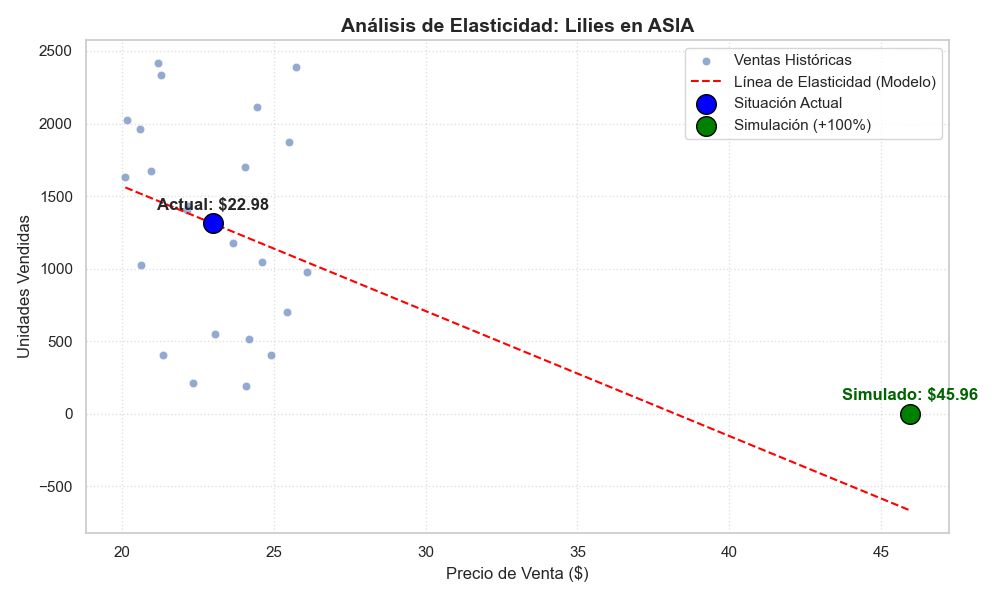
Lilies Elasticity Analysis in Asia.
Lilies in Asia leave a Unit_Margin of only $1.00 (4.7% return). Simulation warns against drastic price increases in a highly sensitive market.
Europe allows for value-based pricing, with Sunflowers delivering a 44.66% margin.
Part V: Strategic Pricing Analysis (The Matrix)
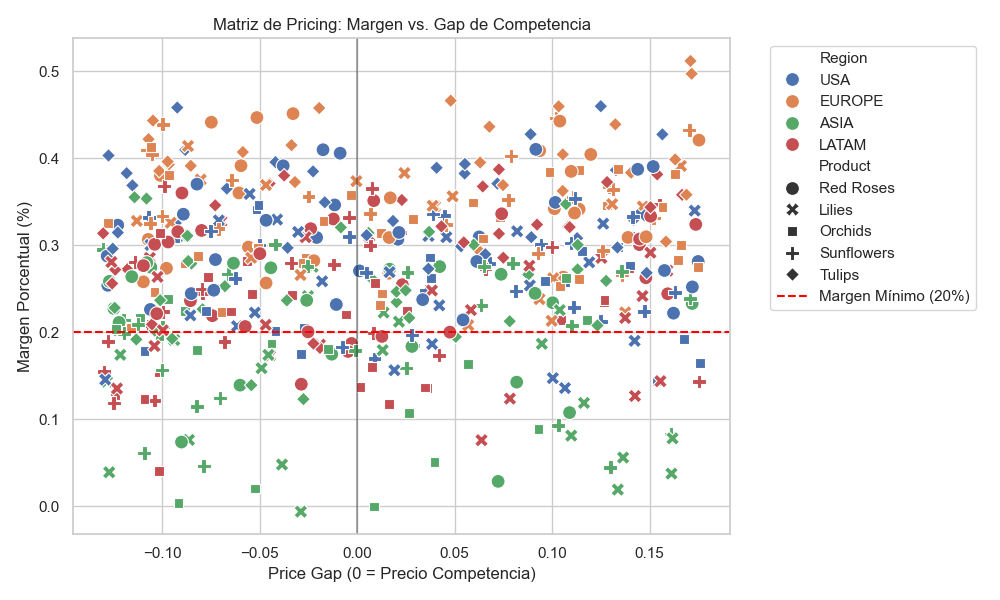
We identified critical zones: Asia requires urgent cost review (we are expensive but with low margin), while USA offers the opportunity to raise prices as we are low-cost leaders with high profitability.
Part VI: Conclusions and Recommendations
- Increase Prices in USA: 5% increase in Red Roses to capture margin without losing volume.
- Audit in Asia: Reduce COGS from $31 to $25 through logistics optimization.
- Rationalization: Discontinue Lilies in Asia if efficiency does not improve.
Final Thoughts: We identified actionable levers to increase regional profitability by 15-20% without acquiring a single new customer.